Audit Logging
This guide covers Anava's audit logging capabilities, including event types, anomaly detection, compliance reporting, and best practices for security monitoring.
Overview
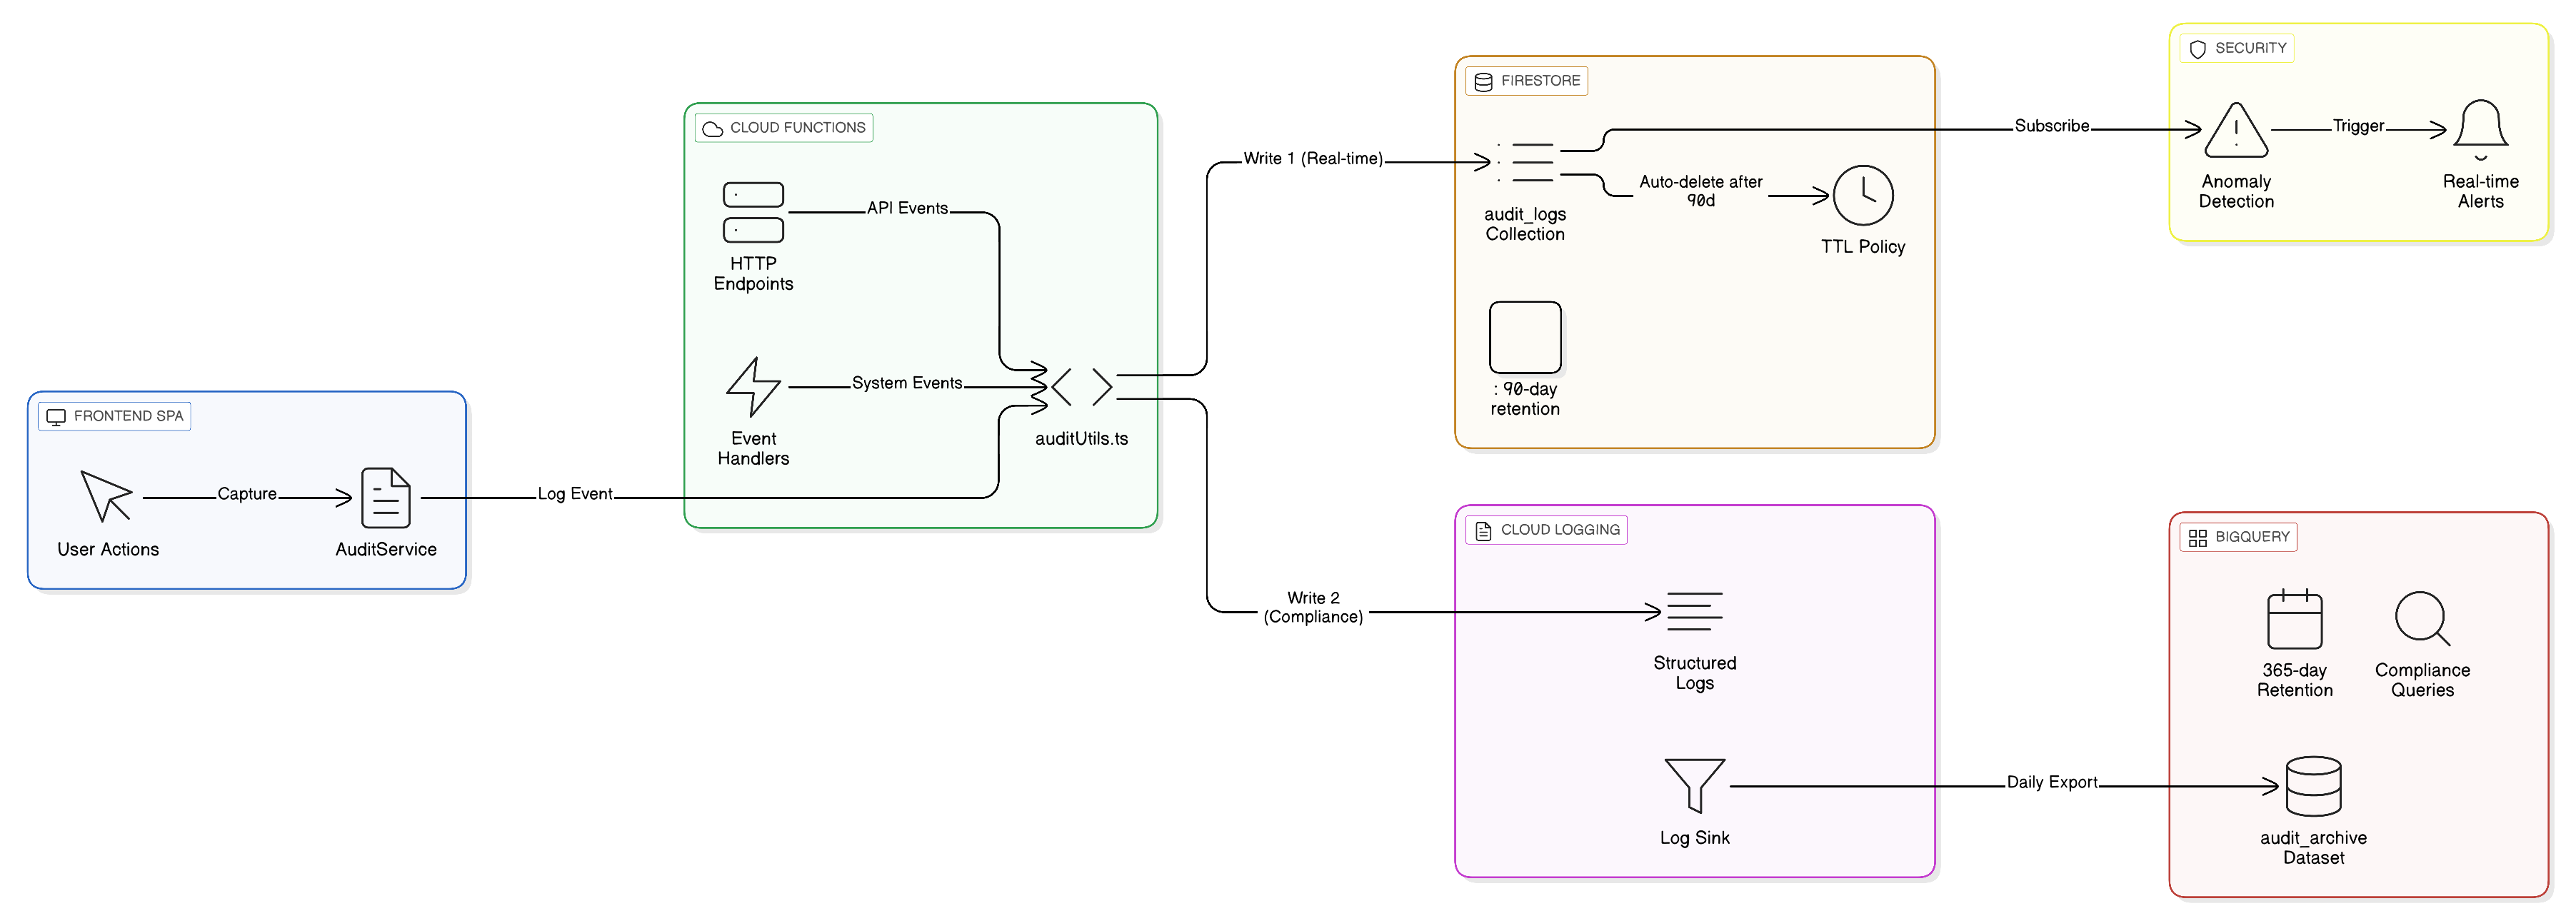
Anava implements a dual-tier audit logging architecture designed to meet enterprise security and compliance requirements. Every significant action in the system is captured, indexed, and available for review.
What Audit Logging Captures
| Category | Examples | Purpose |
|---|---|---|
| Authentication | Login, logout, MFA challenges, failed attempts | Security monitoring |
| User Management | Role changes, account enable/disable | Access control audit |
| Device Operations | Approve, reject, pause, configure | Asset management |
| Configuration Changes | Profile, skill, group modifications | Change management |
| System Events | Maintenance mode, errors, health changes | Operational visibility |
Compliance Coverage
Anava audit logging is designed to satisfy requirements from major compliance frameworks:
| Standard | Key Requirements | Coverage |
|---|---|---|
| SOC 2 Type II | CC7.2 - System operations logging | 40+ event types with immutable storage |
| ISO 27001 | A.12.4 - Logging and monitoring | Dual-tier retention with alerting |
| PCI DSS | 10.2 - Audit trail requirements | Tamper-proof BigQuery archive |
| GDPR | Data access logging | All credential and data access tracked |
| HIPAA | Audit controls | Access logs with user attribution |
Retention Periods
Audit logs are stored in two tiers optimized for different access patterns:
| Tier | Storage | Retention | Access | Use Case |
|---|---|---|---|---|
| Hot | Firestore audit_logs | 90 days | Admin UI | Day-to-day review |
| Cold | BigQuery anava_audit_logs | 365 days | SQL queries | Compliance audits |
Viewing Audit Logs
Accessing the Audit Log Viewer
Navigate to Admin > Audit Logs (/admin/audit) to access the Audit Log Viewer.
Required Role: Admin
User Interface Overview
The Audit Log Viewer provides a real-time, filterable view of all system events:
+------------------------------------------------------------------+
| Audit Log Viewer                                    [Export CSV]  |
+------------------------------------------------------------------+
| Filters:                                                          |
| [Date Range: Last 7 days v] [User: All v] [Action: All v]        |
| [Severity: All v]           [Search...]              [Apply]      |
+------------------------------------------------------------------+
| Time        | User           | Action          | Target    | Sev |
+-------------|----------------|-----------------|-----------|-----|
| 14:32:15    | admin@co.com   | profile.updated | Profile A |  -  |
| 14:30:02    | ops@co.com     | device.approved | CAM-001   |  -  |
| 14:28:44    | unknown        | auth.login_fail | -         | MED |
| 14:25:11    | admin@co.com   | user.role_chg   | viewer@   | LOW |
+------------------------------------------------------------------+
| Showing 1-50 of 1,234 events          [< Prev] [1] [2] [3] [Next >]
+------------------------------------------------------------------+
Filtering Options
| Filter | Options | Description |
|---|---|---|
| Date Range | Last 24h, 7 days, 30 days, Custom | Time window for events |
| User | All, Specific user | Filter by actor email |
| Action Type | Auth, Config, Device, User, System | Event category |
| Severity | All, Low, Medium, High, Critical | Anomaly severity level |
| Search | Free text | Search across all fields |
Real-Time Updates
The Audit Log Viewer supports real-time streaming of new events:
- Auto-refresh: New events appear at the top automatically
- Live indicator: Pulsing dot shows active connection
- Pause/Resume: Click to pause auto-updates while reviewing
Keyboard Shortcuts
| Shortcut | Action |
|---|---|
R | Refresh logs |
E | Export current view |
F | Focus search field |
/ | Open filter panel |
Esc | Clear filters |
J / K | Navigate rows (down/up) |
Enter | View event details |
Event Details Panel
Click any event row to expand details:
{
  "id": "audit_abc123def456",
  "timestamp": "2024-01-15T14:32:15.234Z",
  "eventType": "config.profile_updated",
  "actor": {
    "uid": "user_xyz789",
    "email": "admin@company.com",
    "role": "admin"
  },
  "target": {
    "type": "profile",
    "id": "profile_abc",
    "name": "Entrance Security"
  },
  "changes": {
    "previousValue": {
      "trigger": { "type": "Motion", "sensitivity": 50 }
    },
    "newValue": {
      "trigger": { "type": "Object", "sensitivity": 70 }
    }
  },
  "context": {
    "ipAddress": "192.168.1.100",
    "userAgent": "Mozilla/5.0...",
    "correlationId": "req_456abc",
    "source": "ui"
  },
  "anomalies": []
}
Event Types
Authentication Events
| Event Type | Description | Logged Data |
|---|---|---|
auth.login | Successful login | User, IP, method, MFA used |
auth.logout | User logged out | User, session duration |
auth.login_failed | Failed login attempt | Email attempted, IP, reason |
auth.mfa_challenge | MFA verification requested | User, method |
auth.mfa_success | MFA verification passed | User, method |
auth.mfa_failed | MFA verification failed | User, method, attempts |
auth.password_reset | Password reset initiated | User email |
auth.password_changed | Password successfully changed | User |
auth.session_expired | Session timed out | User, idle duration |
auth.token_refreshed | Auth token renewed | User |
User Management Events
| Event Type | Description | Logged Data |
|---|---|---|
user.created | New user account created | Email, initial role, created by |
user.role_changed | User role modified | Previous role, new role, changed by |
user.enabled | User account enabled | User, enabled by |
user.disabled | User account disabled | User, disabled by, reason |
user.deleted | User account deleted | User email, deleted by |
user.mfa_reset | MFA enrollment reset | User, reset by |
user.group_access_changed | Group permissions modified | Groups added/removed |
user.api_key_created | API key generated | User, key prefix, expiry |
user.api_key_revoked | API key revoked | User, key prefix, revoked by |
Device Operations Events
| Event Type | Description | Logged Data |
|---|---|---|
device.registered | New device connected | Serial, model, IP |
device.approved | Device approved for use | Device ID, approved by |
device.rejected | Device approval rejected | Device ID, rejected by, reason |
device.paused | Device temporarily disabled | Device ID, paused by |
device.resumed | Device re-enabled | Device ID, resumed by |
device.retired | Device permanently removed | Device ID, retired by |
device.config_pushed | Configuration sent to device | Device ID, config version |
device.firmware_updated | Firmware update initiated | Device ID, from/to version |
device.certificate_rotated | Device certificate renewed | Device ID |
device.connection_lost | Device went offline | Device ID, last seen |
device.connection_restored | Device came back online | Device ID, offline duration |
device.error | Device reported error | Device ID, error code, message |
Configuration Events
| Event Type | Description | Logged Data |
|---|---|---|
config.profile_created | New profile created | Profile name, group, created by |
config.profile_updated | Profile configuration changed | Profile ID, changes diff |
config.profile_deleted | Profile removed | Profile ID, deleted by |
config.profile_enabled | Profile activated | Profile ID, enabled by |
config.profile_disabled | Profile deactivated | Profile ID, disabled by |
config.skill_created | New skill created | Skill name, type, created by |
config.skill_updated | Skill configuration changed | Skill ID, changes diff |
config.skill_deleted | Skill removed | Skill ID, deleted by |
config.group_created | New group created | Group name, created by |
config.group_updated | Group configuration changed | Group ID, changes diff |
config.group_deleted | Group removed | Group ID, deleted by |
config.webhook_created | Webhook endpoint added | URL (sanitized), events, created by |
config.webhook_updated | Webhook configuration changed | Webhook ID, changes |
config.webhook_deleted | Webhook removed | Webhook ID, deleted by |
config.integration_enabled | Third-party integration enabled | Integration type, configured by |
config.integration_disabled | Integration disabled | Integration type, disabled by |
System Events
| Event Type | Description | Logged Data |
|---|---|---|
system.maintenance_started | Maintenance mode enabled | Enabled by, reason |
system.maintenance_ended | Maintenance mode disabled | Disabled by, duration |
system.backup_started | Backup process initiated | Backup type, initiated by |
system.backup_completed | Backup successfully finished | Backup size, duration |
system.backup_failed | Backup process failed | Error message |
system.restore_started | Restore process initiated | Backup ID, initiated by |
system.restore_completed | Restore successfully finished | Items restored |
system.export_requested | Data export requested | Export type, requested by |
system.export_completed | Data export ready | Export size, format |
system.health_degraded | System health issue detected | Component, severity |
system.health_restored | System health recovered | Component, downtime |
system.rate_limit_exceeded | API rate limit hit | User/IP, endpoint, limit |
Anomaly Detection
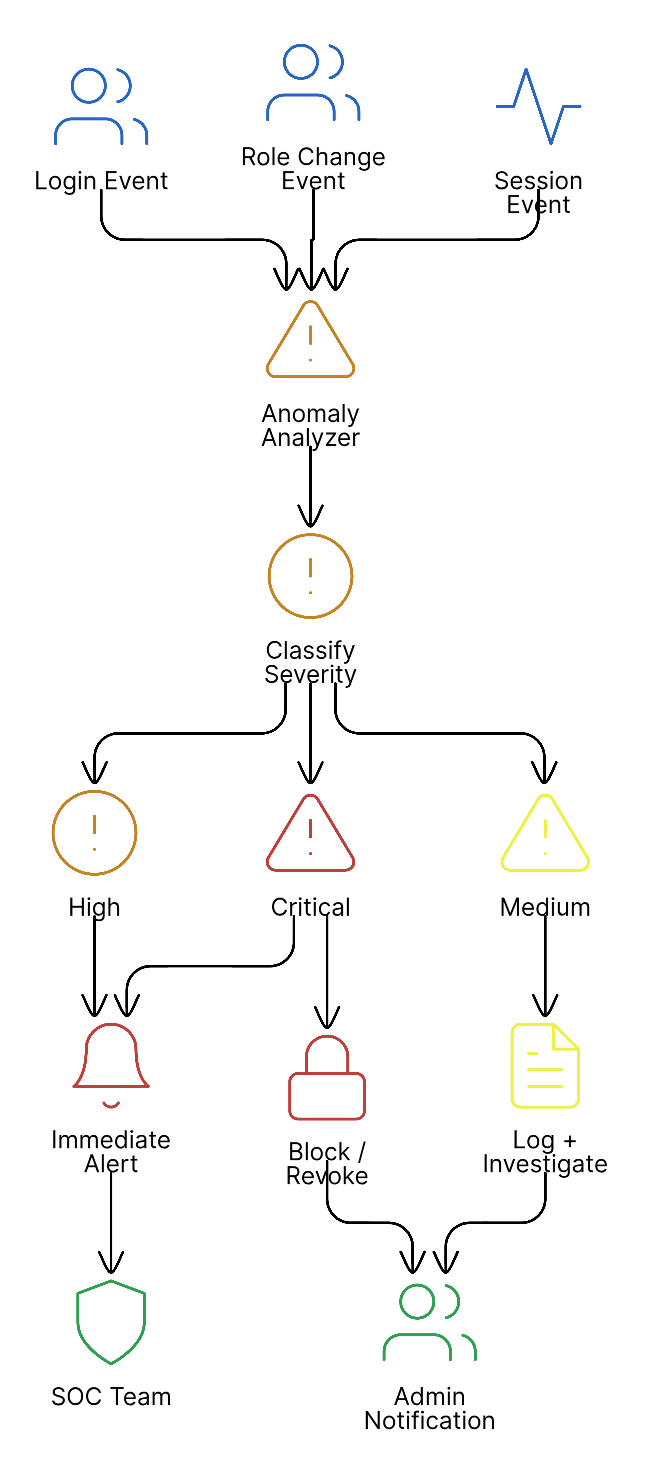
Anava automatically analyzes audit events to identify potentially suspicious activity. Anomalies are flagged with severity levels and surfaced in the Audit Log Viewer.
Anomaly Detection Process
Anomaly Types and Severity
Low Severity
| Anomaly | Trigger Condition | Recommended Action |
|---|---|---|
| Off-Hours Activity | Action performed outside business hours (configurable) | Review for legitimacy; may be normal for remote workers |
Medium Severity
| Anomaly | Trigger Condition | Recommended Action |
|---|---|---|
| New IP Address | First login from an IP not previously seen for this user | Verify with user; may indicate travel or new location |
| Bulk Operations | More than 10 similar actions within 1 minute | Review for accidental or malicious mass changes |
| Geographic Anomaly | Login from location far from usual (>500km) | Verify with user; consider MFA re-verification |
High Severity
| Anomaly | Trigger Condition | Recommended Action |
|---|---|---|
| Sensitive Action | Modification to security settings, user roles, or system config | Review immediately; ensure authorized change |
| Brute Force Attempt | 5+ failed login attempts for same account within 5 minutes | Account may be under attack; consider lockout |
| Privilege Escalation | User role elevated to higher privilege level | Verify authorization; check who approved |
| Unusual Data Export | Large data export or export to new destination | Verify business need; check for data exfiltration |
| After-Hours Admin Action | Admin operations outside business hours | High-risk actions should be during business hours |
Critical Severity
| Anomaly | Trigger Condition | Recommended Action |
|---|---|---|
| Session Hijacking | Session used from different IP/device than original login | Immediately terminate session; force password reset |
| Impossible Travel | Logins from distant locations within impossible timeframe | Account likely compromised; lock immediately |
| Mass Device Operations | Bulk device retirement or rejection | Potential sabotage; halt and investigate |
| Security Control Disabled | MFA requirement disabled or security feature turned off | Escalate immediately; may indicate insider threat |
Anomaly Response Workflow
When anomalies are detected:
-
Automatic Actions (configurable)
- Send email notification to security team
- Trigger webhook to SIEM
- Log to dedicated security stream
-
Review Process
- Filter Audit Log Viewer by severity
- Expand event to see full context
- Mark as "Reviewed" or "Escalate"
-
Resolution Tracking
- Add notes to anomaly record
- Link to incident ticket if created
- Track time to resolution
Configuring Anomaly Detection
Navigate to Admin > Settings > Security > Anomaly Detection:
| Setting | Default | Description |
|---|---|---|
| Business Hours | 08:00-18:00 | Define normal operating hours |
| Business Days | Mon-Fri | Define normal operating days |
| Timezone | Account timezone | Timezone for hour calculations |
| Bulk Threshold | 10 actions/minute | Threshold for bulk operation flag |
| Failed Login Threshold | 5 attempts/5 min | Threshold for brute force flag |
| New IP Alert | Enabled | Alert on first login from new IP |
| Geographic Radius | 500 km | Distance threshold for geo anomaly |
Compliance Reports
SOC 2 User Access Review
Generate quarterly user access reviews required for SOC 2 compliance:
Via Admin UI:
- Navigate to Admin > Audit Logs
- Click Reports > User Access Review
- Select review period (last quarter)
- Click Generate Report
Report Contents:
| Section | Information |
|---|---|
| Active Users | All users with access during period |
| Role Distribution | Count by role (Admin, Operator, Viewer) |
| Role Changes | All role modifications with approver |
| Access Additions | New users added |
| Access Removals | Users removed or disabled |
| Privileged Access | Admin account activity summary |
| Anomalies | Security anomalies during period |
Year-Long Reports via BigQuery
For compliance audits requiring 365-day lookback, query BigQuery directly:
-- All authentication events in past year
SELECT
  timestamp,
  JSON_VALUE(payload, '$.actor.email') as user_email,
  JSON_VALUE(payload, '$.eventType') as event_type,
  JSON_VALUE(payload, '$.context.ipAddress') as ip_address
FROM `project-id.anava_audit_logs.audit_events`
WHERE timestamp > TIMESTAMP_SUB(CURRENT_TIMESTAMP(), INTERVAL 365 DAY)
  AND JSON_VALUE(payload, '$.eventType') LIKE 'auth.%'
ORDER BY timestamp DESC;

-- Role changes audit trail
SELECT
  timestamp,
  JSON_VALUE(payload, '$.actor.email') as changed_by,
  JSON_VALUE(payload, '$.target.email') as user_affected,
  JSON_VALUE(payload, '$.changes.previousValue.role') as old_role,
  JSON_VALUE(payload, '$.changes.newValue.role') as new_role
FROM `project-id.anava_audit_logs.audit_events`
WHERE JSON_VALUE(payload, '$.eventType') = 'user.role_changed'
  AND timestamp > TIMESTAMP_SUB(CURRENT_TIMESTAMP(), INTERVAL 365 DAY)
ORDER BY timestamp DESC;

-- Device approval audit
SELECT
  timestamp,
  JSON_VALUE(payload, '$.actor.email') as approved_by,
  JSON_VALUE(payload, '$.target.id') as device_id,
  JSON_VALUE(payload, '$.target.serial') as serial_number,
  JSON_VALUE(payload, '$.eventType') as action
FROM `project-id.anava_audit_logs.audit_events`
WHERE JSON_VALUE(payload, '$.eventType') IN ('device.approved', 'device.rejected')
  AND timestamp > TIMESTAMP_SUB(CURRENT_TIMESTAMP(), INTERVAL 365 DAY)
ORDER BY timestamp DESC;

-- Security anomalies summary
SELECT
  DATE(timestamp) as date,
  JSON_VALUE(anomaly, '$.type') as anomaly_type,
  JSON_VALUE(anomaly, '$.severity') as severity,
  COUNT(*) as count
FROM `project-id.anava_audit_logs.audit_events`,
  UNNEST(JSON_QUERY_ARRAY(payload, '$.anomalies')) as anomaly
WHERE timestamp > TIMESTAMP_SUB(CURRENT_TIMESTAMP(), INTERVAL 365 DAY)
GROUP BY date, anomaly_type, severity
ORDER BY date DESC, count DESC;
Export Capabilities
Supported Export Formats:
| Format | Best For | Max Records |
|---|---|---|
| CSV | Spreadsheet analysis | 100,000 |
| JSON | Programmatic processing | 100,000 |
| Formal reports | 10,000 |
Scheduled Exports:
Configure automatic exports for compliance:
- Navigate to Admin > Settings > Audit > Scheduled Exports
- Click Add Export Schedule
- Configure:
- Frequency: Daily, Weekly, Monthly
- Format: CSV, JSON
- Destination: Email, Cloud Storage
- Filters: Event types, severity levels
- Save schedule
Compliance Report Templates
Pre-built templates for common compliance needs:
| Template | Framework | Contents |
|---|---|---|
| User Access Review | SOC 2, ISO 27001 | User lifecycle, role changes, access patterns |
| Privileged Access Log | PCI DSS, SOC 2 | All admin actions, elevated operations |
| Authentication Summary | All frameworks | Login patterns, failures, MFA usage |
| Configuration Changes | SOC 2, ISO 27001 | All system configuration modifications |
| Device Management | Custom | Device lifecycle, approvals, operations |
| Incident Timeline | All frameworks | Events around specific date/time |
Best Practices
Regular Review Cadence
Establish a consistent audit log review schedule:
| Review Type | Frequency | Focus Areas | Reviewer |
|---|---|---|---|
| Daily Security Scan | Daily | High/Critical anomalies, failed logins | Security team |
| Weekly Ops Review | Weekly | Device operations, config changes | Operations |
| Monthly Access Review | Monthly | User activity, role changes | Admin |
| Quarterly Compliance | Quarterly | Full access review, generate reports | Compliance |
Alert Thresholds
Configure alerts based on your security posture:
Recommended Starting Thresholds:
| Alert | Condition | Severity | Notification |
|---|---|---|---|
| Failed logins | > 5 in 5 minutes | High | Email + Slack |
| New admin user | Any creation | Medium | |
| Bulk operations | > 20 in 1 minute | Medium | |
| After-hours admin | Admin action after hours | High | Email + SMS |
| Critical anomaly | Any critical | Critical | PagerDuty |
Tuning Guidelines:
- Start conservative - Lower thresholds initially
- Review false positives - Adjust to reduce noise
- Document baselines - Know what "normal" looks like
- Seasonal adjustments - Account for business cycles
Incident Response Integration
Integrate audit logs with your incident response process:
Webhook Integration:
{
  "url": "https://your-siem.example.com/webhook/anava",
  "events": ["auth.login_failed", "user.role_changed", "system.*"],
  "severity_filter": "medium",
  "format": "json",
  "headers": {
    "Authorization": "Bearer ${WEBHOOK_TOKEN}"
  }
}
SIEM Integration Options:
| SIEM | Integration Method |
|---|---|
| Splunk | HTTP Event Collector webhook |
| Datadog | Log forwarding via Cloud Logging |
| Elastic | BigQuery connector or webhook |
| Chronicle | Cloud Logging export |
| QRadar | Syslog forwarding |
Incident Timeline Construction:
When investigating an incident:
- Identify pivot point - The event that triggered investigation
- Expand time window - Look 24-48 hours before/after
- Filter by actor - Focus on involved users
- Export timeline - Generate report for incident documentation
- Preserve evidence - Export to immutable storage before retention expires
Security Operations Checklist
Daily:
- Review high/critical anomalies
- Check failed login patterns
- Verify no unexpected admin actions
Weekly:
- Review device operations
- Check configuration changes
- Verify webhook delivery success
Monthly:
- Generate user access report
- Review and update alert thresholds
- Check for stale user accounts
- Validate BigQuery data ingestion
Quarterly:
- Generate SOC 2 access review report
- Review anomaly detection configuration
- Test incident response procedures
- Verify retention policy compliance
Troubleshooting
Events Not Appearing
Symptom: Actions taken but not showing in Audit Log Viewer
Checklist:
- Check timing - Events may have 1-2 second delay
- Verify filters - Clear all filters and retry
- Check permissions - Ensure admin role
- Check event type - Some actions may not be logged
- Check Firestore - Verify
audit_logscollection is accessible
Missing Historical Data
Symptom: Events older than 90 days not in UI
Resolution: Use BigQuery for historical data:
SELECT * FROM `project.anava_audit_logs.audit_events`
WHERE timestamp < TIMESTAMP_SUB(CURRENT_TIMESTAMP(), INTERVAL 90 DAY)
LIMIT 1000;
Anomaly Detection Not Working
Symptom: Expected anomalies not being flagged
Checklist:
- Check configuration - Verify anomaly detection is enabled
- Review thresholds - May be set too high
- Check business hours - Verify timezone settings
- Test with known trigger - Try 6+ rapid failed logins
Export Failures
Symptom: Export times out or produces incomplete data
Solutions:
- Reduce date range
- Apply additional filters
- Use BigQuery for large exports
- Schedule export during off-peak hours
Related Topics
- Security Configuration - Security settings and policies
- Health Monitoring - System health endpoints
- Backup & Recovery - Data protection procedures
- Fleet Management - Bulk device operations